Analytics for Touch-First Digital Signage

Analytics for passive, non-interactive (ok, “traditional”) digital signage is just guesswork. Barring black magic, there is just no way to directly measure effectiveness. In fact, there has been an unstated assumption that audience exposure, awareness generation, was the best one could hope for. Correlation of signage effectiveness to sales was a faith-based system. ROI was an opinion and message tuning was an instinctive art. Touch-first interactive digital signage is a game changer for analytics.
Collecting What, When and Where
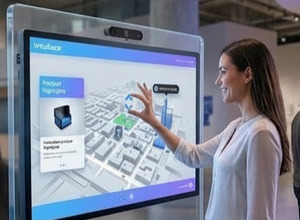
With interactive signage – and touch-first signage in particular, where touch ( or gesture) is a first class citizen – organizations can collect real numbers based on visitor interactions, such as:
- Number of signage uses
- Highest trafficked paths
- Most used signs
With deeper analysis there is actionable business-level data to be found:
- Most popular product/service
- Least popular product/service
- Most common queries
- Most popular times of day
Then there are environmental considerations
- Weather
- Season
- Holiday
- Ongoing sales
The resulting datastore is a goldmine of actionable information with geographic specificity. And this is before incorporating the information collected by the latest innovation, user analytics.
Collecting the Who
Incorporation of an Anonymous Video Analytics (AVA) platform adds a Who dimension to collected data about the What, When and Where. Viewer analytics and biometrics (such as gender/age recognition, headcount, time in front of the screen, etc.), provides even greater insight:
- Among viewers (people who looking at the sign), differentiating bystanders from users, creating an engagement ratio
- Mapping demographics to products – e.g. age/gender of buyer for products in Category A, age/gender of viewers not buying products in Category B
Making it Actionable
The volume of information is overwhelming, so much so that without a plan, you’ll just drown in data than find a way to use it successfully. Here are just some examples of how you could orient your usage data collection activities.
- Adjust content (messaging, products displayed, graphics, etc.) – even in real time! - to make signage more relevant and engaging for a given location.
- Better anticipate content and aesthetics for new signage
- Test content – e.g. via A/B testing – in a live environment with immediate feedback.
Getting Started
So the big remaining question is how to make all of this possible. We’ve built IntuiFace from the ground up to not only enable fine-grained and versatile data collection but to easily support integration with third party information resources and analytic platforms. But what does that mean in practice? What should you look for from any platform?
- Ability to capture and store what could be very large amounts of data (Big Data), fuelled by a range of sensor technologies monitoring an enormous range of activities as well as very diverse environmental inputs.
- Collected analytics data must be easily ingested by back-end Business Intelligence systems. This means the data should be formatted using modern approaches like XML and JSON and then accessible over the Web via the REST protocol, for example. This is particularly important if you have other analytic sources like mobile devices.
- Ability to easily merge analytic content coming from multiple (10s, 100s, 1000s) devices. Data must be correlated to find patterns and to tweeze apart correlation from causation.
- Real-time data collection, if possible, as it accelerates the speed at which information becomes actionable
- Freedom to track any type of interaction. This is not just about pushing a button or viewing a product. How about most popular pages in a book. The most common place viewers stop a video. The most common link clicked in embedded Web browsers.
With interactive digital signage, signage is literally coming out of the dark ages and entering a quantifiable, actionable age.