Announcing Intuiface Analytics with Brand New Charts & Dashboard Feature

Today we are pleased to announce the introduction of Intuiface Charts & Dashboards.
Interactivity + Analytics = The Insight You've Been Missing
Today we are pleased to announce the introduction of Intuiface Charts & Dashboards. Intuiface now delivers complete analytics support, packaged in an easy-to-adopt Web interface enabling even the total novice to turn their data into insight.
Why analytics? You're building interactive content for a reason - you have a goal - and need to know how well you're doing. Ask yourself if it's important to answer these questions:
- Design: How well does your experience design drive users towards your goal?
- Operational: How well is the infrastructure supporting your experience's ability to drive users towards that goal?
- Business: How well is goal the being fulfilled and what have you learned about your target audience?
For some time, Intuiface has enabled you to track user interactions and collect contextual information (like weather, gender, and more) to give those interactions context. What was missing was a means for analyzing this rich set of collected data. Intuiface users were asked to adopt often complex third party analytics tools, limiting the advantages of analytics to the few who already had extensive experience.
Intuiface Charts & Dashboards changes all of that.
What's New?
- Powerful yet easy to adopt chart creation capabilities:
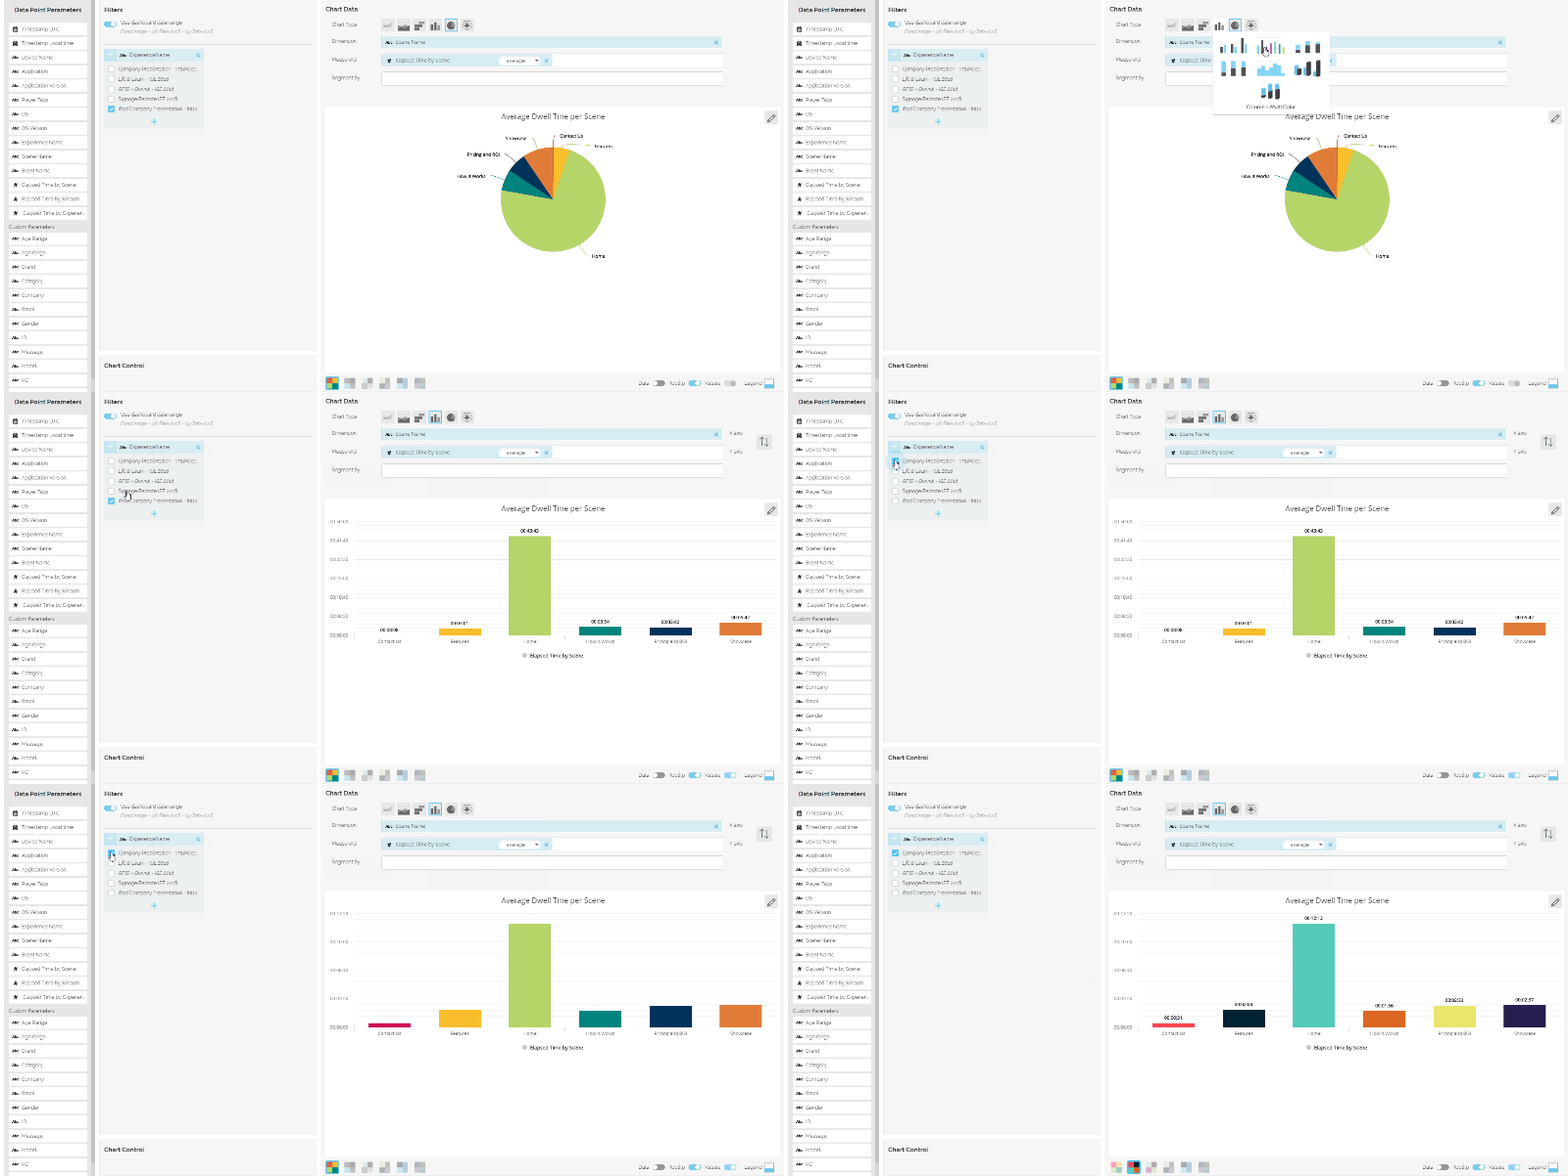
Simple drag-and-drop approach to chart and filter creation. Includes 30+ chart styles and multiple configuration options for telling a story with data.

- Agile dashboarding for chart organization and sharing:
Organize charts by dashboard, sharing them via URL or embeddable iframe. Use for real-time insight or as snapshots in time. Customize with your own logo.

- Extensive chart template library and demo data sets:
For most of us, analytics is an unfamiliar skill. We've created 15+ templates and extensive demo data sets so you can experiment and gain experience.

- Simplified packaging and licensing :
Just three annual and one manual option to choose from. All support unlimited data point collection. Plans with dashboard support permit unlimited chart creation.
Analytics is no longer a domain reserved for subject matter experts. Anyone creating interactive content - from sales teams to digital agencies to museum exhibition owners - can define, collect, visualize and share the data that lead to insight.


